Search

404

The page you are looking for no longer exists or you have entered the wrong address.

Browser not supported

Modern websites need modern browsers

To enjoy the full experience, please upgrade your browser

Try this browser
A pie chart showing the count of papers with CQT co-authors in 2024 by journal impact factor

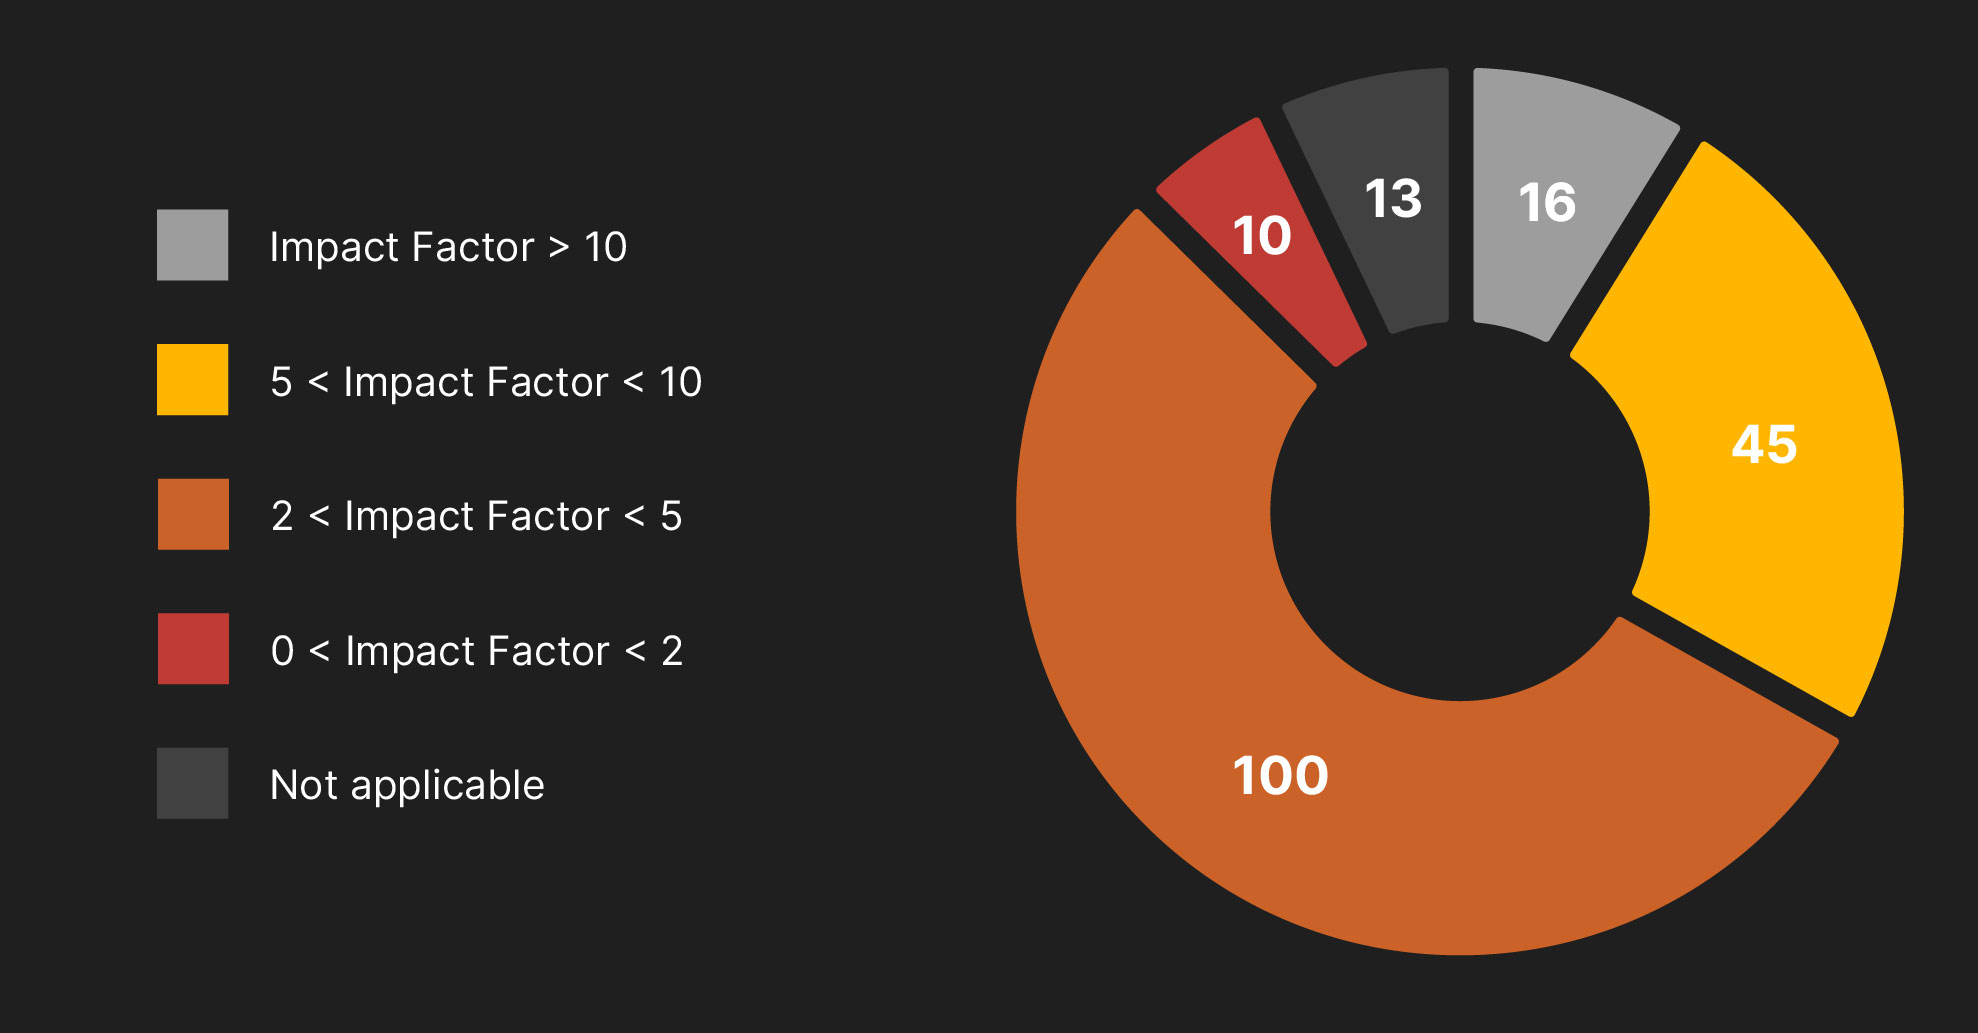
Publications by CQT researchers during 2024 by journal impact factor (IF)​

A pie chart showing the nationality of CQTians by region of the world.

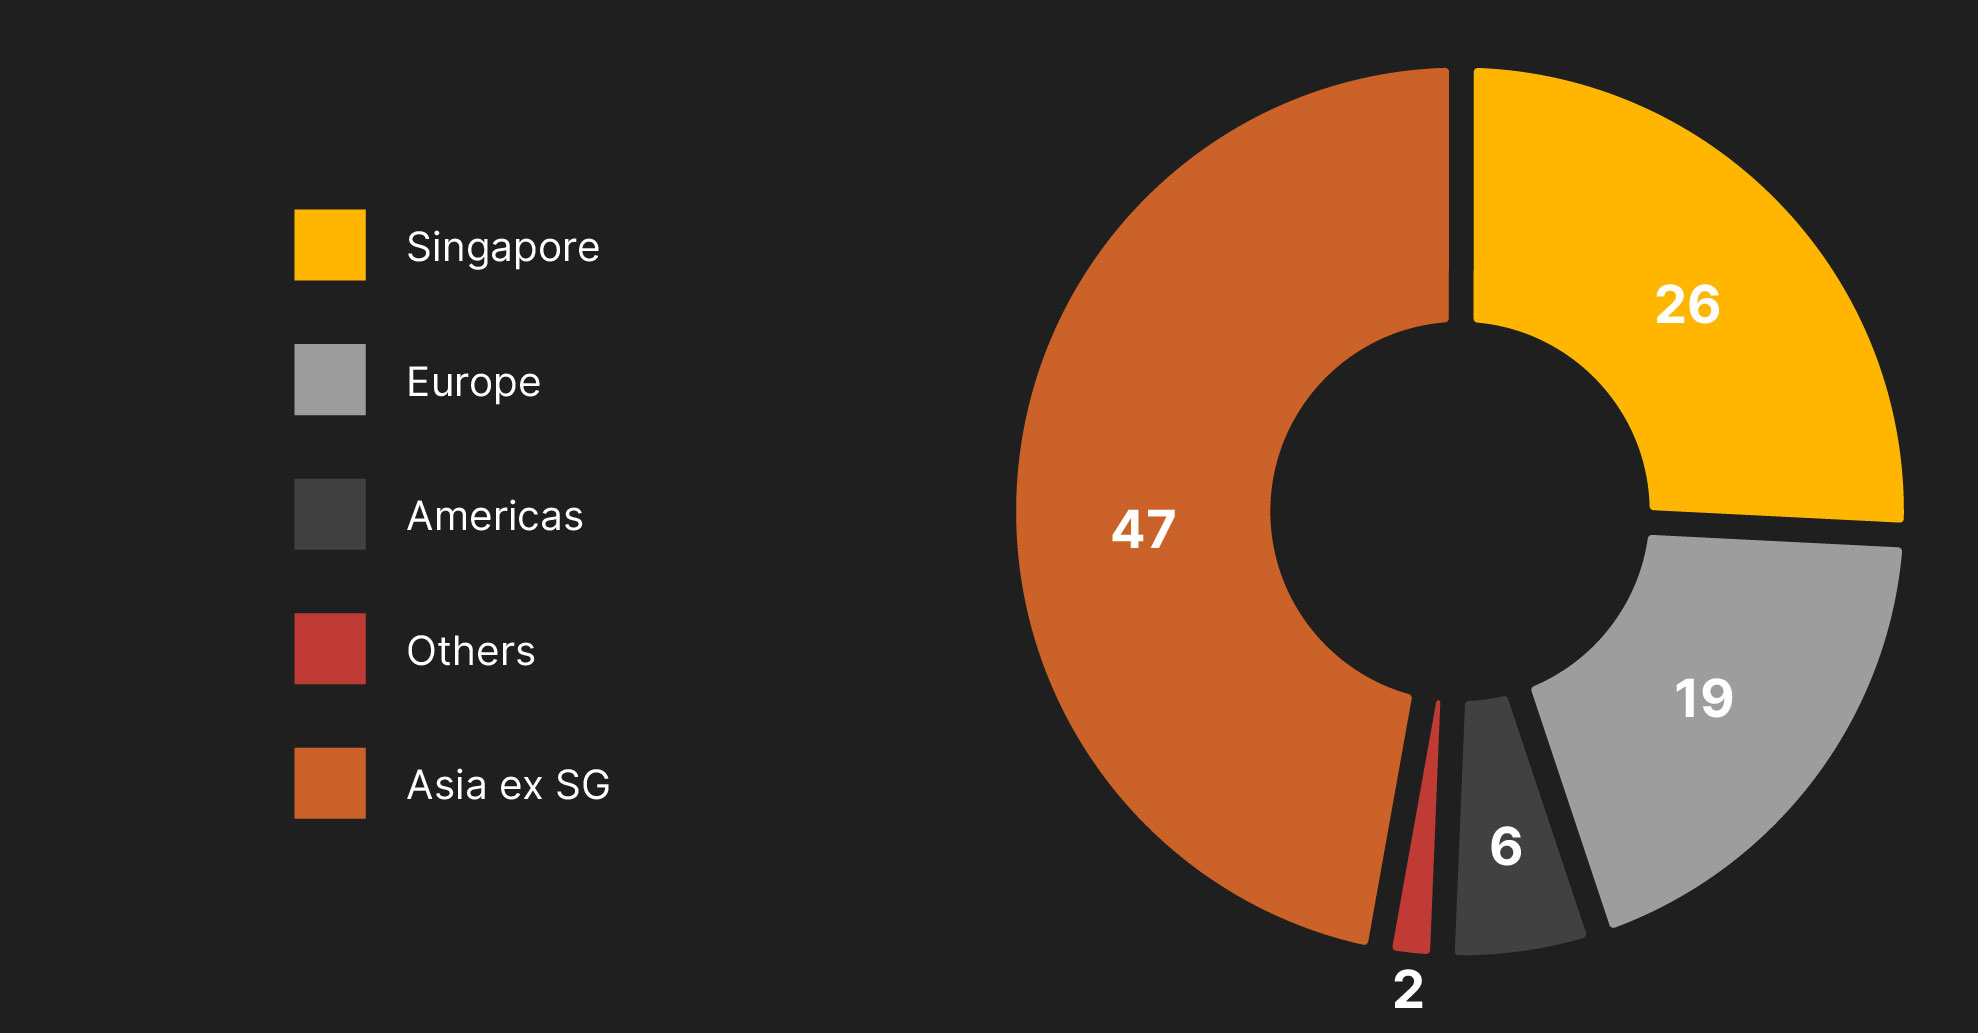
Nationalities of CQT staff and students as of 31 Dec 2024​

A pie chart showing the count of CQTians by categories

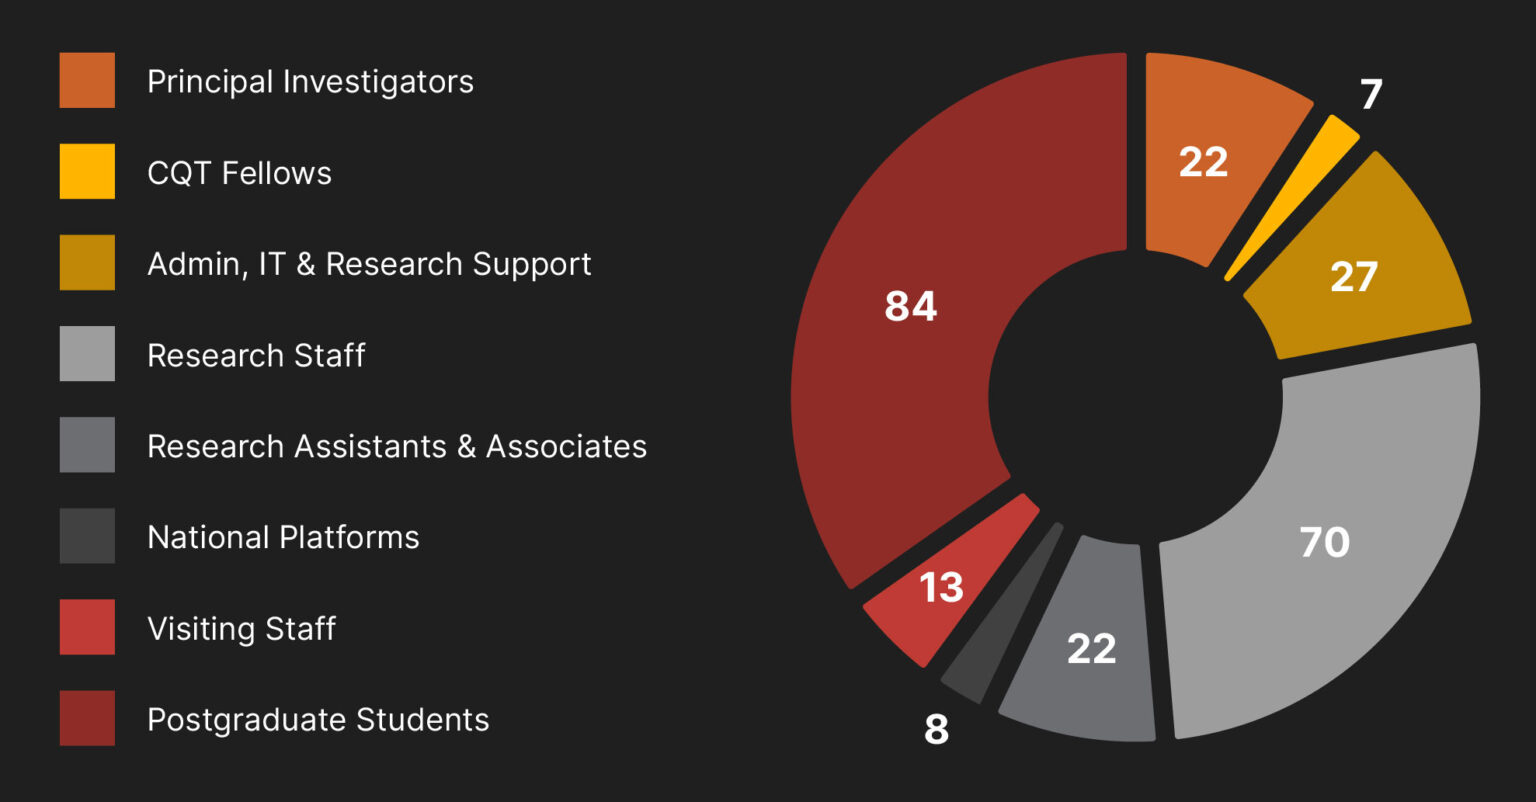
Count of CQT staff and students as of 31 Dec 2024​

*Admin count includes only staff directly employed within the Centre. HR, IT and procurement is supported by additional staff working across University centres.